Use Cases
There are a variety of ways to use the QGreenland data package, and below you can explore many examples of those different ways through use case scenarios shared by our colleagues. These use cases showcase how QGreenland is being used across research, education, planning, decision-making, and other applications. If you would like to contribute a use case, please reach out to the QGreenland team!
This page is under construction.
❄ Building a Unified QGIS Project for Ice Mask Mapping
A case study by Gregor Luetzenburg
Use type(s): Research – publication visual; Research – adding data; Data collection sharing; Team data coordination | Discipline(s): Glaciology
Who are you and what do you do?
I am a glaciologist leading a team mapping the outline of the Greenland Ice Sheet and its peripheral glaciers.
How did you use QGreenland?
I use QGreenland to build a unified QGIS project, which I distribute to my project partners so that everyone works within the same framework.
Read more
What question or problem were you trying to address, and why is it important?
The ice mask mapping required delineating the outline of the Greenland Ice Sheet and its peripheral glaciers using a consistent, up-to-date reference. Ice margins in Greenland are dynamic, so an accurate, current outline is essential. It underpins mass balance calculations, glacier change detection, and a wide range of downstream cryospheric research that relies on knowing precisely where ice is (and is not) at a given point in time.
How did you use QGreenland in your work?
I used QGreenland to build a single, unified QGIS project bundling all the relevant reference layers, imagery, and prior ice masks needed for the mapping work. I then distributed this project to my team and project partners so that everyone digitizing outlines was working from the same base data, coordinate reference system, and layer setup, rather than each person assembling their own patchwork of sources.
What did QGreenland enable you to do that you couldn’t do before?
QGreenland let me standardize the working environment across a distributed team without having to manually track down, reproject, and package every dataset myself. Instead of each collaborator sourcing their own imagery and reference layers (with the risk of mismatched projections or outdated data), QGreenland gave everyone a shared, ready-to-use framework from day one thereby saving setup time and reducing inconsistencies in the final compiled outline.
What would you tell someone considering using QGreenland?
If you are coordinating a multi-person mapping or analysis effort in Greenland, QGreenland is worth adopting early. It removes a lot of the tedious data-wrangling overhead and ensures everyone is working from the same baseline. It is particularly valuable for collaborative projects where consistency across contributors matters as much as the individual mapping work itself.
About the contributor
Gregor Luetzenburg is a postdoctoral researcher with the Geological Survey of Denmark and Greenland.
Learn more in the video below!
❄ Identifying Field Sites for Hydrological Study
A case study by Megan Black
Use type(s): Research – exploration of field area; Teaching; Field planning; Data exploration; Finding out what data exists in an area; Team data coordination; Outreach; For fun! | Discipline(s): Geological sciences; Hydrology; Education
Who are you and what do you do?
I am a PhD candidate working to identify how deglaciated landscapes respond post-glaciation to climate change in the Arctic. I use remote sensing and GIS applications in my work to access remote locations in southwest Greenland to better amplify our understanding of these landscapes.
How did you use QGreenland?
I use QGreenland to identify potential study areas in my research. I also have used it in the third chapter of my dissertation to support an education module targeted to help Greenlandic high school and undergraduate students to learn remote sensing and GIS skills.
Read more
What question or problem were you trying to address, and why is it important?
I participated in two extensive field seasons in Greenland with 18 fellow multidisciplinary researchers. Our group aimed to pull together a breadth of knowledge to understand how the Arctic is changing and adapting to climate change. The graduate students of this team were also required to produce a dissertation chapter related to science outreach and education.
How did you use QGreenland in your work?
QGreenland provided material for our group to better understand our field sites prior to deployment. This included locating streams within our study area that are both connected and disconnected from the ice sheet, the type of parent bedrock and soil types present at these streams, and specific watersheds that were accessible to us. Additionally, I included QGreenland in an educational GIS module created for the use of Greenlandic high schools.
What did QGreenland enable you to do that you couldn’t do before?
QGreenland enabled our team to better understand our study area prior to deployment. As many of the team, including most of the PIs, had not been to Greenland before, we had a limited understanding of the field and the area that would be of interest to us before landing.
What would you tell someone considering using QGreenland?
QGreenland is an excellent resource that can aid researchers in better planning a field season in Greenland. It is also useful as a repository for educators and students to have access to GIS data in Greenland.
About the contributor
Megan Black is a PhD candidate and graduate assistant at the University of Florida.
Learn more in the video below!
❄ Finding Available GIS Data for Planning
A case study by Frederik Hass
Use type(s): Field planning; In-field awareness; Data exploration; Finding out what data exists in an area | Discipline(s): Surveying and Mapping
Who are you and what do you do?
I am part of a public company that carries out both public mapping and commercial projects. The projects include UAV flight, general maps, satellite data analysis, bathymetry, ground surveys, etc.
How did you use QGreenland?
I consider myself to be an experienced user of different GIS software, and, therefore, the data in the QGreenland package has more interest to me than the actual QGreenland QGIS project. I mostly use the project and data package to see what available data there is in some specific area. And then I use the data in my own project or go directly to the source to get more information.
Read more
What question or problem were you trying to address, and why is it important?
Is there any data available in the area?
Where is it coming from, and is there potentially more at the source?
How did you use QGreenland in your work?
When having projects in locations that are unknown to us where we, for example, need data for planning purposes.
What did QGreenland enable you to do that you couldn’t do before?
For example, hydrographic data (water depths) can be difficult to find on its own, but QGreenland has it.
What would you tell someone considering using QGreenland?
Don’t rely too much on the QGIS Project itself. That is, to me, just a representation of data. Instead, try to go one level deeper at use as an entry point for locating data sources.
About the contributor
Frederik Hass is the Head of Geodata and Mapping with the Asiaq - Greenland Survey.
Learn more about this workflow in the video below!
❄ Planning Sensor Placement Utilizing Satellite Data
A case study by Ruth Mottram
Use type(s): Research – publication visual; Resarch – adding data; Research – presentation visual; Research – exploration of field area; Teaching; Field planning; In-field awareness; Data exploration; Finding out what data exists in an area; Team data coordination; Outreach; For fun! | Discipline(s): Polar climate science; Glaciology
Who are you and what do you do?
I work as a regional climate modelling scientist at the intersection of ice sheet, atmosphere, and ocean in Greenland and Antarctica. We are refining the inclusion of the cryosphere in very high-resolution regional climate models with process studies using satellite and in-situ data with the aim to ultimately improve sea level rise projections.
How did you use QGreenland?
I use QGreenland to plan and execute fieldwork in Greenland, for example, by planning where I lay out sensor placements and by importing the latest satellite imagery to assess sea ice state. I also use QGreenland to visualize datasets, both satellite and from field observations, to see how measurements fit in the wider context.
Read more
What question or problem were you trying to address, and why is it important?
I have used QGreenland for several different projects, but most recently in the context of a project assessing the role of melange in front of marine terminating glaciers in modulating calving behaviour. The literature has a lot of conflicting ideas about melange, with some studies suggesting it may play a controlling role in buttressing some large outlet glaciers.
How did you use QGreenland in your work?
Import of satellite pictures to determine where GNSS marker buoys should be placed and to produce maps that help navigation in the field.
Import of plotted measurements and satellite derived datasets (ArcticDEM, ESA CCI ice velocity from Sentinel 1, ESA CCI SEC data) for comparison over a wider region as well as with built in datasets in QGreenland.
What did QGreenland enable you to do that you couldn’t do before?
Easily compare wide area and wide range of data in the region. Simplify the selection of field sites and up to date production of field navigation.
What would you tell someone considering using QGreenland?
It's a really useful tool and very helpful for geospatial projects in a range of disciplines in Greenland.
About the contributor
Ruth Mottram is the Chief Scientific Advisor with the Danish Meteorological Institute.
❄ Producing DEMs of the Greenland Ice Sheet
A case study by Mai Winstrup
Use type(s): Research – publication visual; Research – presentation visual; Teaching | Discipline(s): Glaciology; Remote Sensing
Who are you and what do you do?
I am a researcher on remote sensing of the Greenland ice sheet. I also teach university courses in GIS.
How did you use QGreenland?
For research, I use base layers for making nice maps of Greenland for publications and presentations. I also use QGreenland to provide context when looking at my own data in GIS. For teaching, I recommend QGreenland to students who want to make a GIS project involving Greenland.
Read more
What question or problem were you trying to address, and why is it important?
My research is in glaciology. One of my main focus points is producing digital elevation models (DEMs) of the Greenland ice sheet and studying how its elevation changes over time.
How did you use QGreenland in your work?
I produce annual DEMs of the ice sheet "offline" based on ICESat-2 and CryoSat-2. I use QGreenland base layers as the background (e.g., Greenland coastline) in the maps in the manuscript where these DEMs are described so that readers can see the data in the correct context.
What did QGreenland enable you to do that you couldn’t do before?
Without QGreenland, I would have needed to find suitable base layers from other sources, which would have taken extra work.
What would you tell someone considering using QGreenland?
I would suggest trying QGreenland to see whether it has what you need. What I found most useful was having a set of data available in one place that I could go through easily and choose from, rather than searching for each layer separately.
About the contributor
Mai Winstrup is a senior researcher with the Technical University of Denmark.
❄ Integrating Multidisciplinary Datasets to Map Historical Calving
A case study by Louise Maria
Use type(s): Research – exploration of field area; In-field awareness; Data exploration; For fun! | Discipline(s): Earth and Space Physics and Engineering
Who are you and what do you do?
As a Master's student at the Technical University of Denmark (DTU), I am deeply interested in studying Greenland's evolving environment. Specifically, my research focus centers on Glacial Isostatic Adjustment (GIA) and its impacts on the region's ice dynamics and crustal movement.
How did you use QGreenland?
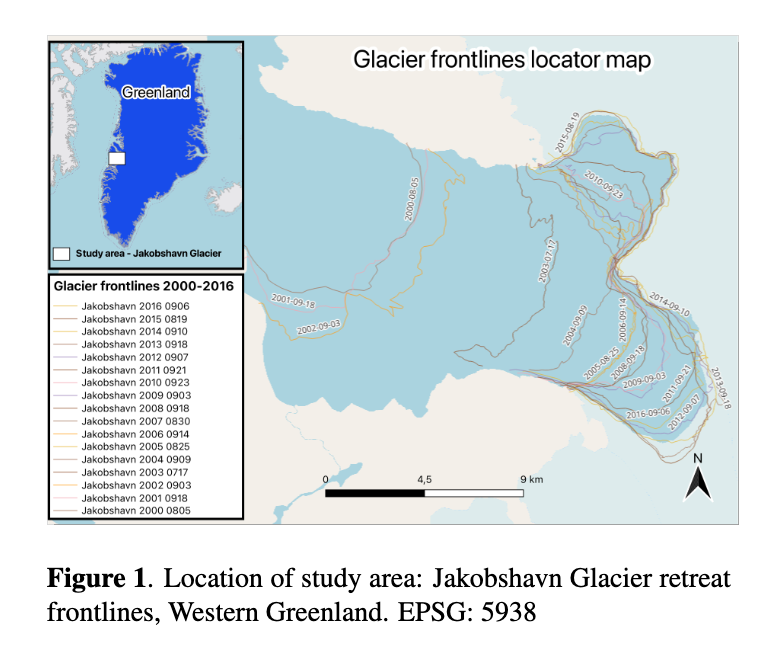
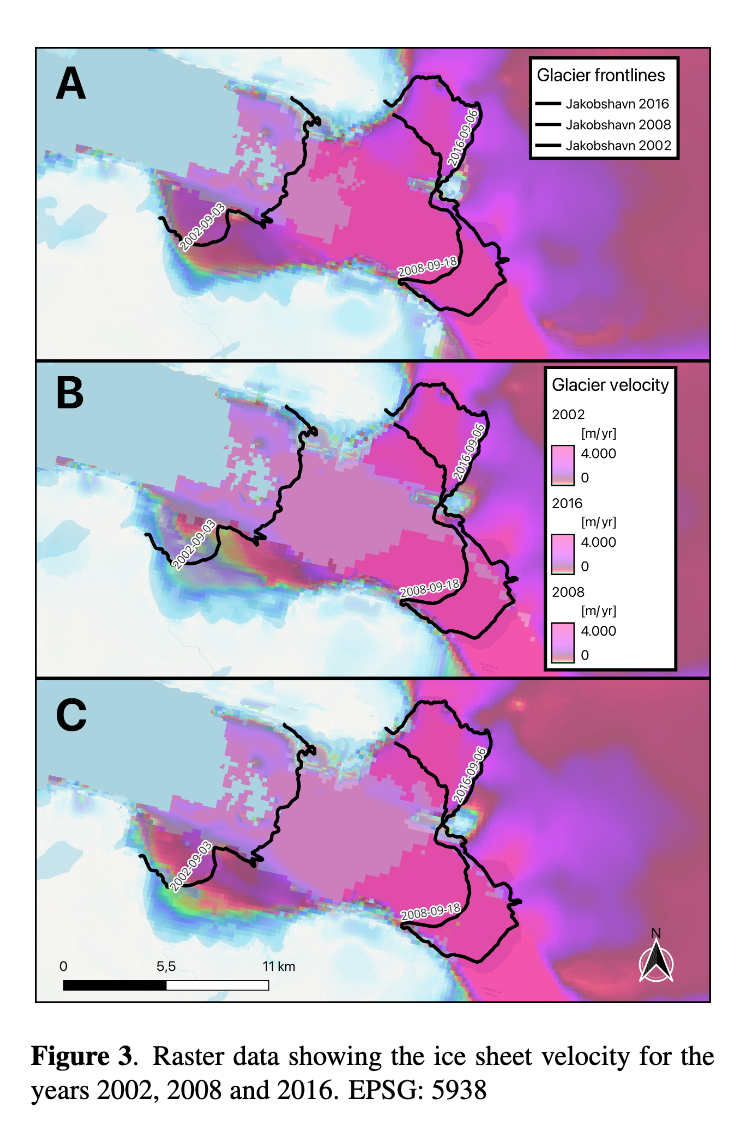
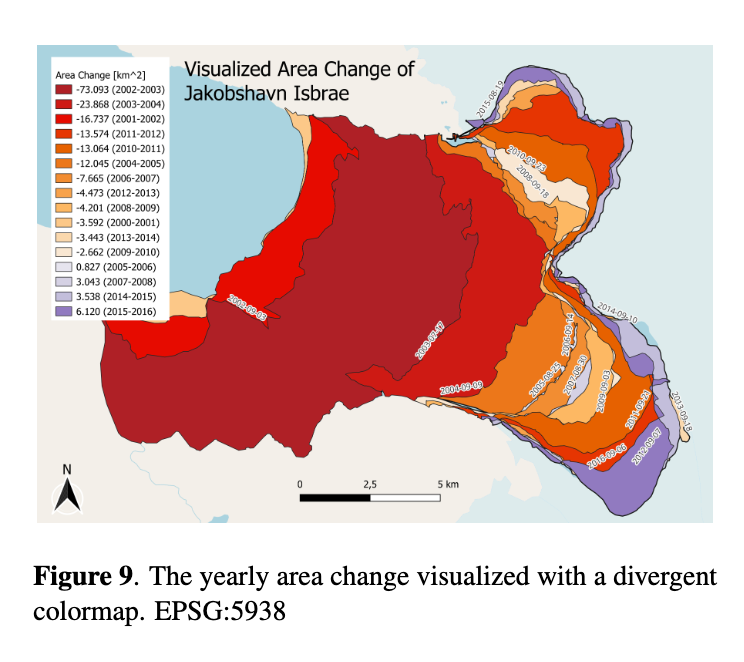
In the project my group and I did in 2024, we investigated the acceleration and retreat of the Jakobshavn Isbrae calving front over the period 2000–2016. By performing annual area calculations, we mapped the changes in ice area and compared these findings with glacier velocity to analyze a potential correlation. Concurrently, we conducted a statistical analysis of 2016 population data for the nearby Greenlandic coastal settlements. Through this analysis, we identified four specific cities near the glacier that are uniquely vulnerable to the socio-economic challenges caused by the retreat. This exposure directly threatens local infrastructure, the tourism sector, and deeply rooted cultural traditions such as dog sledding and ice fishing.
Read more
What question or problem were you trying to address, and why is it important?
How has the calving frontline area of the Jakobshavn Isbrae glacier changed between 2000 and 2016, and what is the correlation between this retreat and the glacier's velocity?
Which coastal settlements near the Jakobshavn Isbrae glacier are most vulnerable to its accelerated retreat based on 2016 population data?
In what ways does the glacier retreat impact the infrastructure, economy, and traditional livelihoods—such as ice fishing and dog sledding—in the affected communities?
How did you use QGreenland in your work?
To integrate and analyze the multidisciplinary datasets, we utilized QGreenland, a QGIS-based geospatial platform. This environment allowed us to map the historical calving frontlines of Jakobshavn Isbrae and perform annual area calculations using satellite imagery. Additionally, we leveraged QGreenland’s built-in ice sheet velocity layers and community infrastructure data to spatially correlate the physical glacier retreat with the geographic locations and demographic vulnerability of the four nearby coastal settlements.
What did QGreenland enable you to do that you couldn’t do before?
With QGreenland it enabled us to immediately overlay human socioeconomic data (town locations, infrastructure) directly on top of glaciological layers (ice velocity, calving fronts). This spatial bridge allowed you to transition from pure physics to human impact in a single workspace.
What would you tell someone considering using QGreenland?
If you are doing any spatial research involving Greenland, do not start from scratch—use QGreenland. It is a game-changer because it eliminates the weeks of data-wrangling, downloading, and re-projecting usually required for Arctic research, allowing you to jump straight into your actual analysis.
About the contributor
Louise Maria is a Master's student with the Technical University of Denmark.
Learn more in the figures below!
❄ Using DEMs to Inform Radar Surveys
A case study by Neosha Narayanan
Use type(s): Research – adding data; Research – exploration of field area; Field planing; Data exploration; Finding out what data exists in an area | Discipline(s): Glaciology
Who are you and what do you do?
I am a glaciologist interested in glacier motion and subglacial hydrology. I use both ice-penetrating radar observations and modeling to understand these processes better.
How did you use QGreenland?
I used layers from QGreenland to help inform a field study our team carried out at Helheim Glacier in Southeast Greenland.
Read more
What question or problem were you trying to address, and why is it important?
Our team is trying to understand how water flows in the firn aquifer at Helheim Glacier. This aquifer, which sits in partially compacted snow near the surface of the ice sheet, delays the delivery of meltwater runoff to the ocean and to the bed of the ice, which affects not only Helheim's contribution to ocean dynamics but also the speed of Helheim's sliding over the bed. Our radar studies provide a more detailed look into how water reaches and travels through the aquifer.
How did you use QGreenland in your work?
I used the DEMs provided by QGreenland to inform where we would carry out our radar surveys.
What did QGreenland enable you to do that you couldn’t do before?
It provided a super easy and centralized way to view and explore different data layers at our study site. It saved me a lot of headache in trying to manually download data products from various websites.
What would you tell someone considering using QGreenland?
It is advantageous to use because someone else has already done all the work of compiling and centralizing useful spatial data on Greenland!
About the contributor
Neosha Narayanan is a PhD Candidate with Georgia Institute of Technology.